Skip to main content Skip to footer

Equality, diversity and inclusion

We are committed to creating better housing, supporting independence and creating new opportunities for people.

The statistics below provide information regarding our tenants, colleagues and board.


Female

Male

Trans-gender

No. of primary tenants with known data

Region Female

Region Male

East

40.6%

59.4%

0.0%

315

50.9%

49.1%

East Midlands

38.9%

60.8%

0.3%

1,023

50.8%

49.2%

London

52.5%

47.5%

0.0%

139

51.7%

48.3%

North East

38.5%

61.5%

0.0%

205

51.2%

48.8%

North West

61.2%

38.7%

0.0%

8,421

51.0%

49.0%

Scotland

40.3%

59.7%

0.0%

77

51.5%

48.5%

South East

33.4%

66.6%

0.0%

320

51.2%

48.8%

South West

35.4%

64.6%

0.0%

99

51.5%

48.5%

West Midlands

14.7%

85.3%

0.0%

34

50.8%

49.2%

Wales

17.6%

82.4%

0.0%

17

51.1%

48.9%

Northern Ireland

100.0%

0.0%

0.0%

3

50.8%

49.2%

Yorkshire & the Humber

43.0%

56.9%

0.1%

785

51.0%

49.0%

Total 2024/25

55.5%

44.4%

0.1%

11,438

51.1%

48.9%

Total 2023/24

55.4%

44.5%

0.1%

11,434

51.1%

48.9%

      Actuals correct as at April 2025 (Next update due April 2026)


% of primary tenants with a disability

% of primary tenants without a disability

Total Number of primary tenants with known data

Region

East

100.0%

0.0%

315

18.4%

East Midlands

100.0%

0.0%

660

19.2%

London

100.0%

0.0%

152

13.7%

North East

100.0%

0.0%

205

21.8%

North West

77.4%

22.6%

2,784

19.4%

Scotland

100.0%

0.0%

77

19.6%

South East

100.0%

0.0%

321

16.6%

South West

100.0%

0.0%

96

20.7%

West Midlands

100.0%

0.0%

33

18.4%

Wales

100.0%

0.0%

17

21.6%

Northern Ireland

100.0%

0.0%

3

24.3%

Yorkshire & the Humber

100.0%

0.0%

752

17.9%

2024/25 Total

88.4%

11.6%

5,415

19.0%

2023/24 Total

90.5%

9.5%

5,198

19.0%

      Actuals correct as at April 2025 (Next update due April 2026)


% of ethnic minorities tenancy

holders


% of ethnic minorities primary tenants

% of non-ethnic minorities primary tenants

Total Number of primary tenants with known data

Region


East

3.1%

96.9%

194

8.3%


East Midlands

13.5%

86.5%

680

8.5%


London

25.5%

74.5%

55

34.7%


North East

4.2%

95.8%

71

5.0%


North West

2.7%

97.3%

6,439

7.2%


Scotland

1.4%

98.6%

69

4.0%


South East

11.9%

88.1%

109

11.8%


South West

1.3%

98.7%

76

3.9%


West Midlands

33.3%

66.7%

12

15.8%


Wales

0.0%

100.0%

4

6.2%


Northern Ireland

-

No data held

0

3.2%


Yorkshire & the Humber

7.0%

93.0%

640

14.9%


2024/25 Total

4.2%

95.8%

8,349

8.9%


2023/24 Total

4.3%

95.7%

8,236

7.7%


            Actuals correct as at April 2025 (Next update due April 2026)


UK

European

None European Country

Total Number of primary tenants with known data

Region


UK

Euro

Non Euro

East

96.3%

2.9%

0.7%

136

88.5%

7.8%

3.7%

East Midlands

99.5%

0.3%

0.3%

400

83.2%

12.7%

4.1%

London

97.2%

0.0%

2.8%

36

78.6%

12.9%

8.4%

North East

98.0%

0.0%

2.0%

50

95.6%

2.4%

2.1%

North West

96.3%

2.9%

0.8%

4,689

92.9%

4.4%

2.7%

Scotland

97.0%

3.0%

0.0%

33

93.3%

4.3%

2.4%

South East

99.0%

0.0%

1.0%

103

89.5%

6.5%

4.0%

South West

100.0%

0.0%

0.0%

48

93.3%

4.8%

1.9%

West Midlands

100.0%

0.0%

0.0%

12

87.7%

6.5%

5.9%

Wales

100.0%

0.0%

0.0%

4

49.4%

36.7%

13.9%

Northern Ireland

No date held

1

31.9%

3.9%

64.3%

Yorkshire and the Humber

98.8%

0.6%

0.6%

485

87.4%

7.1%

5.5%

2024/25 Total

96.8%

2.4%

0.8%

5,997

91.3%

6.4%

2.2%

2023/24 Total

97.0%

2.4%

0.6%

5,671

92.5%

5.9%

1.6%

           Actuals correct as at April 2025 (Next update due April 2026)


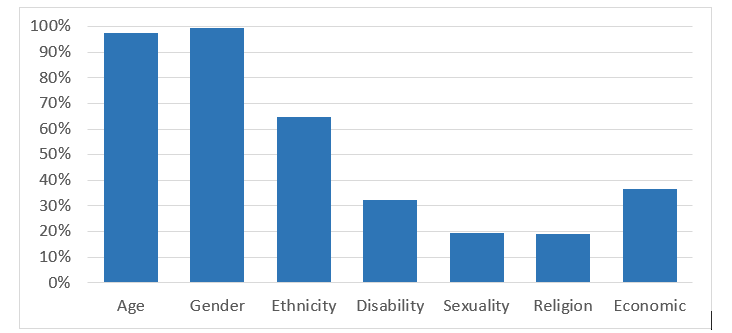
As at April 2025 the Group held 53% of characteristic information about our residents. This % of known characteristic data varies across categories. 

Age

  • 14.8% of residents are under 16, 12.6% are in the range 16-25, 16.2% 25-35, 14.2% 35-45, 12.1% 45-55, 13.7% 55-65 and 16.4% over 65.

Gender and household

  • 51.3% of residents are female, 48.6% are male and 0.1% are transgender.  Of the 11,326 tenanted homes, 29.6% are households with children and 80.8% are single person households.
  • 27.6% of single person households are people aged 60 or over.

Ethnicity

  • 4.4% of residents consider themselves to be from an ethnic minority background.

Disability 

  • 80.4% of household occupants within the homes we manage (known response from 31% of them) state that they have some form of disability. 

Nationality

  • 95.4% have informed us that they are from the UK, with 3.3% from the European Union (or Europe) and 1.2% from the rest of the world.

Religion

  • 0.4% of household occupants informed us that they are Buddhist. 0.1% re Hindu. 0.3% are Jewish. 0.1% are Sikh and 1.6% are Muslim. 

Sexual orientation

  • 2.5% have informed us that they are part of the wider LGBTQ+ community.

Marital status

  • 17% informed us that they are married, 33.8% single, 5.3% divorced and 4.2% are cohabitating.

Age

•    3% of employees are in the range 16-25, 15% 25-35, 28% 35-45, 27% 45-55, 23% 55-65 and 4% over 65.

Gender

•    55% of employees are female and 45% are male.

Ethnicity

•    4.2% of employees consider themselves to be from an ethnic minority background.

Disability 

•    8% of employees have informed us that they have some form of disability.

Nationality

•    97.5% of employees have informed us that they are from the UK, with 1.7% from the European Union (or Europe) and 0.8% from the rest of the world.

Religion

•    0.2% of employees informed us that they are Buddhist. 0.4% are Sikh and 1.5% are Muslim.

Sexual orientation

•    4.9% have informed us that they are part of the wider LGBTQ+ community.

Marital status

•    54.7% of employees have informed us that they are married, 22.8% single, 4.5% divorced and 18.1% are cohabitating.

Age

•    9% of board members are under 35, 73% 55-65 and 18% over 65.

Gender

•    55% of the board members are female.

Ethnicity

•    9% of the board members consider themselves to be from an ethnic minority background

Disability

•     1 member of the board has disclosed that they have some form of disability

Nationality

•    3 board members informed us they are British. We do not know for the other board members.

Religion

•    2 board members are Christian. 1 is Agnostic. We do not know for the other board members

Sexual orientation

•    1 board member informed us that they are part of the wider LGBTQ+ community


Marital status

•    1 board member is cohabitation. We do not know for the other board members

Age

•    19% of SLT are in the range 35-45, 50% 45-55 and 31% 55-65.

Gender

•    31% of the SLT members are males.

Ethnicity

•    Only 1 SLT member consider themselves to be from an ethnic minority background.

Disability

•    None of the 17 SLT members who have disclosed this information have some form of disability

Nationality

•    1 member informed us they are Non European where 8 others disclosed that they are British.

Religion

•    12 SLT members are Christian.
 
Sexual orientation

•    Only 1% of the SLT members informed us that they are part of the wider LGBTQ+ community

Marital status

•    36% of the SLT members are married or living in a civil partnership, 29% single, 21% are cohabitating and 14% are divorced.